基于社区的igraph组顶点
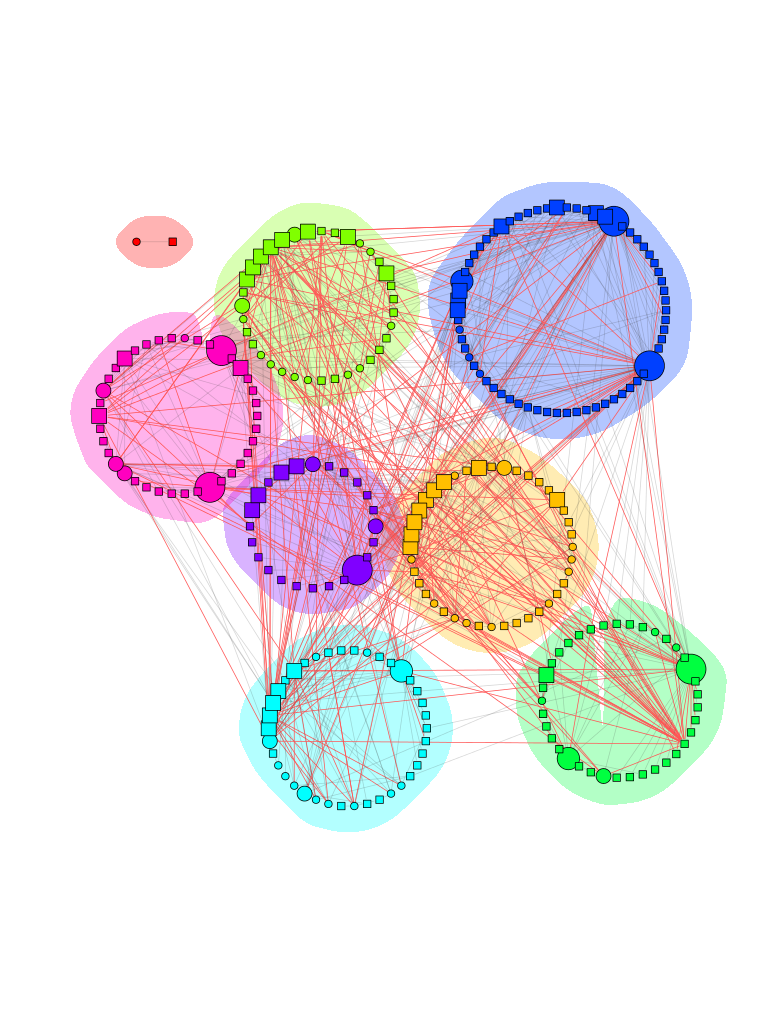
在我之前的问题Creating Variables with Group in R igraph中,我希望将具有相同组/颜色的顶点放在我的数据类型中,就像这个https://lists.nongnu.org/archive/html/igraph-help/2012-03/pngFA9V_3yRcA.png一样。提前致谢
1 个答案:
答案 0 :(得分:2)
我在我的NetPathMiner包中实现了这样一个功能,名为layoutVertexByAttribute。
library(igraph)
library(NetPathMiner)

g <- graph.data.frame(message)
g <- setAttribute(g, "sender", sender_country)

l = layoutVertexByAttr(g, "sender", cluster.strength=10, layout=layout.kamada.kawai)

plotNetwork(g, vertex.color="sender",layout=l)

编辑:
如果您不使用Bioconductor,安装软件包似乎有点困难,我会在这里编写一个更简单的函数版本。
layout.by.attr <- function(graph, wc, cluster.strength=1,layout=layout.auto) {
        g <- graph.edgelist(get.edgelist(graph)) # create a lightweight copy of graph w/o the attributes.
        E(g)$weight <- 1

        attr <- cbind(id=1:vcount(g), val=wc)
        g <- g + vertices(unique(attr[,2])) + igraph::edges(unlist(t(attr)), weight=cluster.strength)

        l <- layout(g, weights=E(g)$weight)[1:vcount(graph),]
        return(l)
}
将它与您的示例一起使用:
g <- graph.data.frame(message)

l = layoutVertexByAttr(g, sender_country, cluster.strength=10, layout=layout.kamada.kawai)

plot.igraph(g, vertex.color=sender_country, layout=l)
相关问题
最新问题
- 我写了这段代码,但我无法理解我的错误
- 我无法从一个代码实例的列表中删除 None 值,但我可以在另一个实例中。为什么它适用于一个细分市场而不适用于另一个细分市场?
- 是否有可能使 loadstring 不可能等于打印?卢阿
- java中的random.expovariate()
- Appscript 通过会议在 Google 日历中发送电子邮件和创建活动
- 为什么我的 Onclick 箭头功能在 React 中不起作用?
- 在此代码中是否有使用“this”的替代方法?
- 在 SQL Server 和 PostgreSQL 上查询,我如何从第一个表获得第二个表的可视化
- 每千个数字得到
- 更新了城市边界 KML 文件的来源?